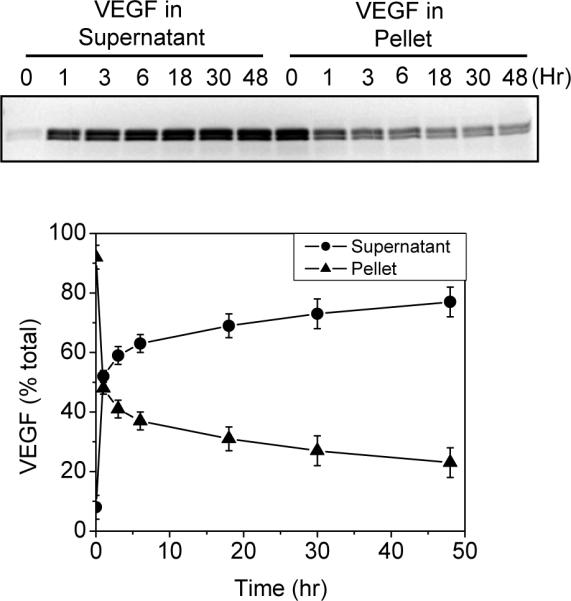
Figure 7. In vitro VEGF release time course.

VEGF PECs were prepared at a VEGF/DS/CS ratio of 0.12/1/0.33. The PECs were diluted in Release Buffer, divided into small aliquots, and placed on a rotating mixer at 37°C. At the specified time point, aliquots were removed from the incubation and immediately centrifuged to separate the released VEGF (supernatant) and the PEC VEGF (pellet). The VEGF in these samples was determined by SDS PAGE and densitometry analysis. The upper panel shows a representative SDS gel loaded with supernatants and pellets of the samples collected at the indicated incubation time. The lower panel shows the percentage of VEGF in the supernatant (circle) or the pellet (triangle) at each incubation time point. Data are presented as mean ± standard deviation of four sets of samples from two experiments.
