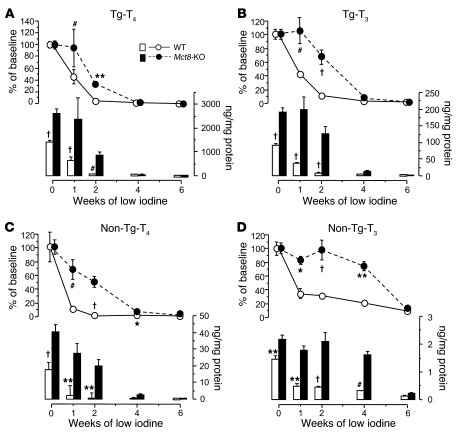
Figure 10. Effect of low-iodine diet on thyroidal TH content of WT and Mct8-KO mice.
Content of Tg-T4 (A) and Tg-T3 (B) (T4 and T3 contained within the Tg molecule) and non-Tg-T4 (C) and non-Tg-T3 (D) (T4 and T3 in the thyroid gland not within the Tg molecule). Values are expressed in absolute amount (bars) and percentage of the mean baseline value of the corresponding genotype (lines). *P < 0.05, **P < 0.01, #P < 0.001, †P < 0.0001.

