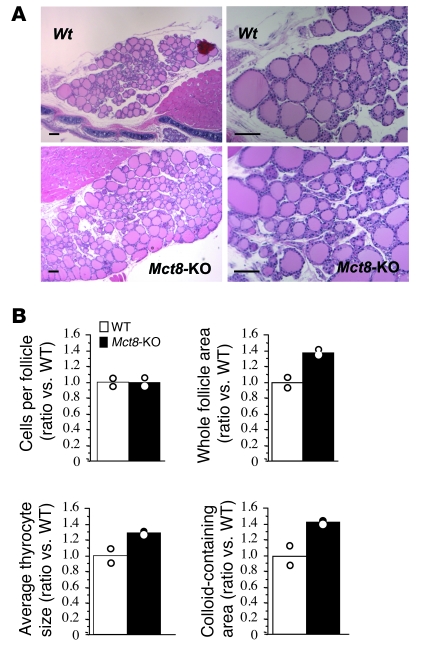
Figure 4. Histology of WT and Mct8-KO mouse thyroid glands.
(A) Low- (left) and higher-power (right) views of H&E-stained sections from thyroid glands of 14-week-old WT and Mct8-KO mice. Scale bars: 100 μm. (B) Morphometric analysis of thyroid gland sections showing the number of cells per follicle, whole follicle area, average thyrocyte size, and colloid-containing area (for details, see Methods). The data are expressed relative to WT and presented as mean and variance.

