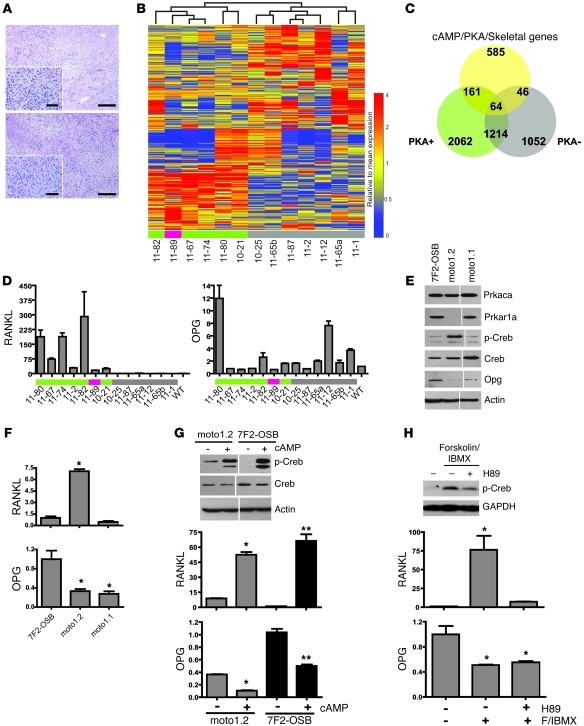
Figure 4. A molecularly defined mouse OSA subclass exhibiting RANKL overexpression.
(A) PKA+ and PKA– mouse OSAs show equivalent histological characteristics. Shown are H&E-stained end stage tumors from MOTO mice of more than 20 weeks of age in the PKA– (top) and PKA+ (bottom) groups. Scale bars: 50 μm. (B) Unsupervised analysis using the cAMP/PKA/skeletal gene set for 13 MOTO OSA tumors highlights distinct subclass representing PKA CNAs (green indicates Prkar1a deletion; red indicates Prkaca amplification; and gray indicates no PKA CNA). (C) Three-way overlap of overexpressed or underexpressed genes in the PKA+, PKA– MOTO OSA, and the cAMP/PKA/skeletal gene set. (D) qPCR of RANKL and OPG RNA in WT bone and 13 MOTO tumors (colored rectangles are same as in B). (E) Western blots and (F) qPCR of the indicated molecules in the 7F2-OSB and moto cell lines. (G) Western blots of total and phospho-CREB protein in cells treated with (+) or without (–) 1.5 mM cAMP for 30 minutes, and qPCR shows the effect of 8-hour cAMP treatment on RANKL and OPG. (H) Effect of 30 minutes 25 μM Forskolin/40 μM IBMX with or without 30 μM H89 treatment on phospho-CREB levels and on the expression of RANKL and OPG. Endogenous actin or GAPDH serve as protein loading controls. All analyses were performed in triplicate on 3 separate occasions; the hairline divider indicates samples run on the same blot. *P < 0.05 and **P < 0.01 indicate significance relative to 7F2-OSB or to untreated control. Data are represented as mean ± SEM.

