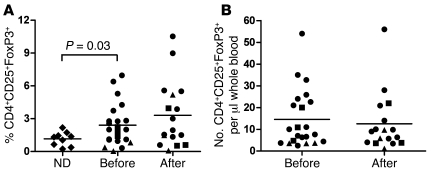
Figure 1. Treg analysis for patients and healthy volunteers.
Patient blood was analyzed prevaccination and at week 12 (3 weeks following the fourth and final vaccination) by flow cytometry staining for CD4+CD25+ and intracellular FoxP3 to determine percentage of Tregs. (A) The percentage of CD4+CD25+FoxP3+ cells and the (B) number of CD4+CD25+FoxP3+ cells per μl whole blood are represented for each patient by a square for cohort 1, triangle for cohort 2, and circle for cohort 3 (maximal tolerated dose [MTD]) at prevaccination week 0 and postvaccination week 12. (A) The percentage of CD4+CD25+FoxP3+ cells of normal donors (ND) was determined and analyzed using the same methods and is presented as a comparison (diamonds). The mean (bar) is also represented for ND, before vaccination, and after vaccination. Statistical significance is noted by Student’s t test between percentage of Tregs of normal donors and cancer patients in the study (P = 0.03). The differences in the percentage of Tregs before and after vaccination are not statistically significant for any of the vaccine doses (P > 0.2).

