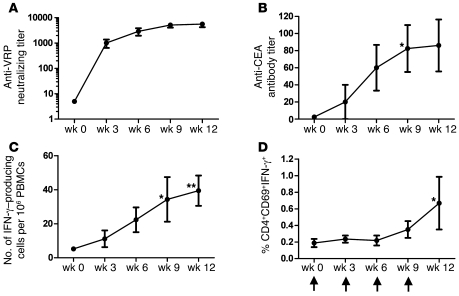
Figure 2. Immune analysis following VRP-CEA(6D) vaccination.
Patient sera or PBMCs were analyzed before and after VRP-CEA(6D) for each immunization for MTD cohort by (A) anti-VRP microneutralization assay; (B) CEA ELISA; (C) VRP-CEA ELISpot; and (D) intracellular IFN-γ. (A) Patient sera were analyzed for anti-VRP antibodies by microneutralization assay for weeks 0, 3, 6, 9, and 12. The antibody titer is presented for each week as mean ± SD. The endpoint titer was defined as the last serum dilution at which there was at least 80% reduction in the number of GFP-positive cells compared with control wells. (B) Patient sera were tested against CEA protein by ELISA for weeks 0, 3, 6, 9, and 12. The antibody titer is represented over the course of the 4 vaccinations as mean ± SEM. A single patient with an outlier titer of 1:1,600 at week 9 was not included in the data presented in the graph but was included for statistical analysis. *P = 0.02. (C) Patient PBMCs were stimulated with VRP-CEA (MOI 10) in an ELISpot assay. The number of IFN-γ–producing cells per 106 PBMCs is presented as mean ± SEM. *P = 0.01; **P = 0.005. (D) Patient PBMCs were stimulated with VRP-CEA (MOI 1) and incubated for 12 hours in an intracellular cytokine assay. The percentage of cells that were CD4+CD69+IFN-γ+ is presented as mean ± SEM. Time of vaccinations is represented by arrows on the x axis of graph (D). Regression analysis with repeated measures was used to analyze assay results over time. Time points where the mean significantly differed from baseline are indicated on the graph (P values are adjusted for multiple comparisons). *P = 0.01.

