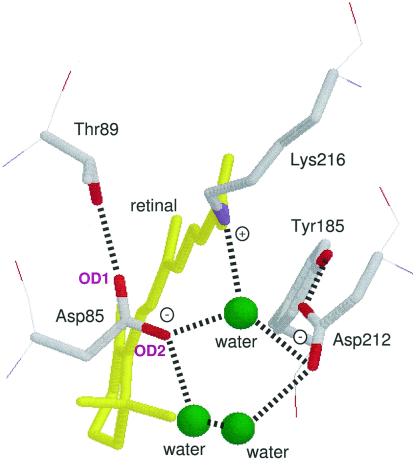
Figure 1.
Structure of the Schiff base region in BR. This is the side view of Protein Data Bank structure 1C3W (10), which has a resolution of 1.55 Å. The membrane normal is approximately in the vertical direction of this figure. Dotted lines represent supposed hydrogen bonds. The O—H group of Thr-89 forms a hydrogen bond with an oxygen atom of the side chain of Asp-85 (OD1), whereas two water molecules are within the hydrogen bonding distance of the other oxygen (OD2).

