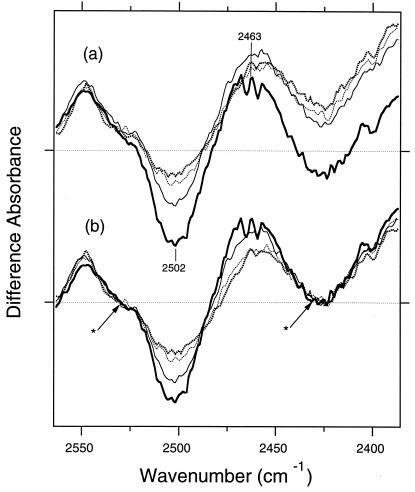
Figure 3.
The M minus BR difference spectra in the 2,565–2,385 cm−1 region. The sample was hydrated with D2O. The window tilting angles are 0° (thick dotted lines), 17.8° (thin dotted lines), 35.7° (thin solid line), and 53.5° (thick solid line). One division of y axis corresponds to 0.001 absorbance unit. The raw spectra are shown in a, whereas b shows spectra normalized so that in each case the absorbance at 2,530 and 2,430 cm−1 (asterisks) was reduced to zero.

