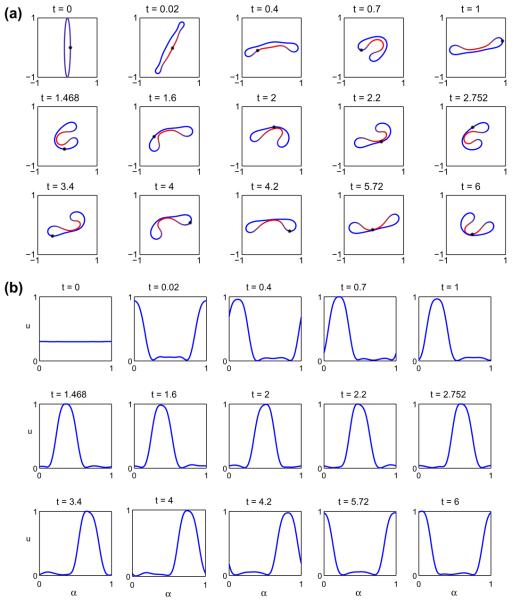
Fig. 11.
A multicomponent vesicle tumbling under an applied shear with a 30–70 mixture of lipid phases: ū = 0.3 with Δ = 6.5682, ∊ = 0.1 and Pe = 1. (a) The evolution of the vesicle at the indicated times (color online: blue and red correspond to the u = 0 and u = 1 phases, respectively). (b) The concentration u at the corresponding times. (For interpretation of the references to colour in this figure legend, the reader is referred to the web version of this article.)

