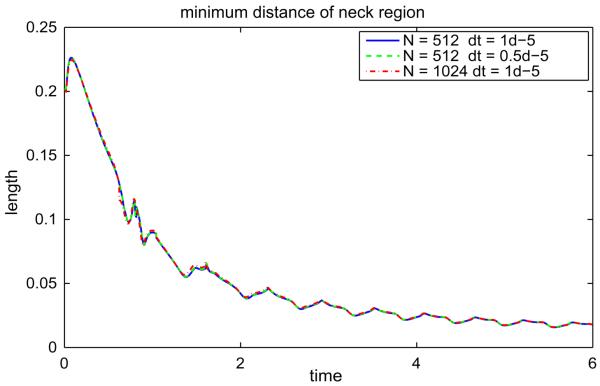
Fig. 12.
The minimum distance of neck region from the vesicle shown in Fig. 11 is shown in (a) with different spatial resolutions and time-step sizes. The solid line indicates N = 512 with Δt = 1 × 10⁻⁵, the dashed line indicates N = 512 with Δt = 0.5 × 10⁻⁵ and dash-dotted line represents N = 1024 with Δt = 1 × 10⁻⁵.

