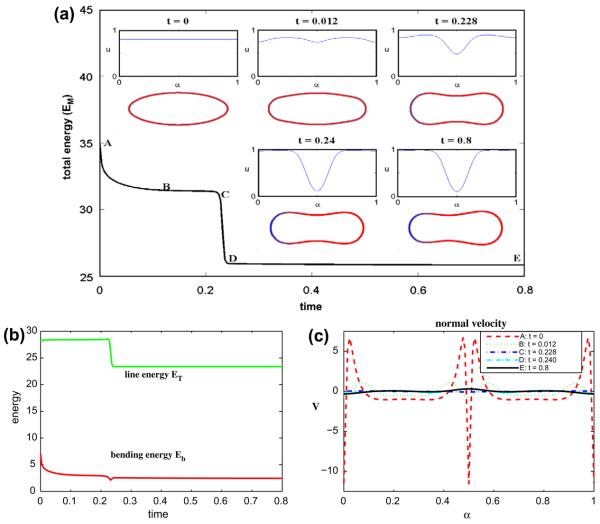
Fig. 5.
Multicomponent vesicle evolution with a 80–20 mixture of lipid phases: ū = 0.8 with ∊ = 0.1 and Pe = 1. (a) The evolution of the total energy EM. Insets: vesicle morphologies and surface phase concentration u at indicated times (color online: blue and red correspond to the u = 0 and u = 1 phases, respectively). (b) The energy components: the line energy ET and the bending energy Eb. (c) The normal velocity. (For interpretation of the references to colour in this figure legend, the reader is referred to the web version of this article.)

