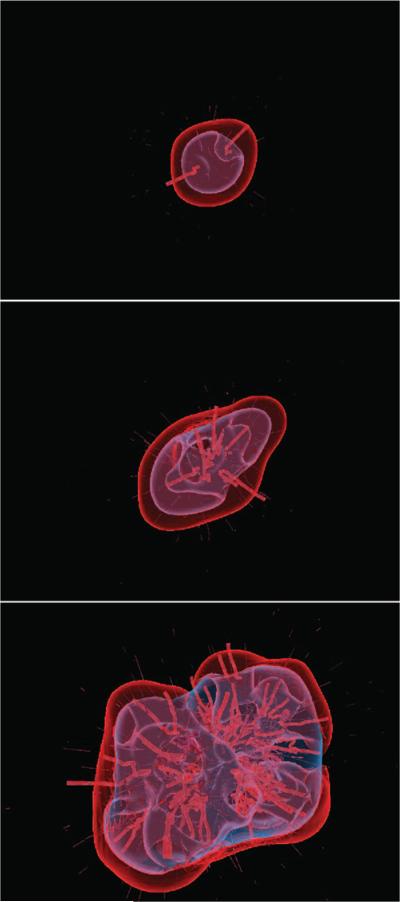
Figure 15.
Study of human glioma using a multiscale 3D mixture model [192, 193, 555]. Viable tissue (region between red outer tumour boundary and inner purple boundary), necrosis (region interior to inner purple boundary) and vasculature (thick red lines: mature blood-conducting vessels; thin light red lines: new non-conducting vessels) are shown. The three-month time sequence (top to bottom) shows the effects on the morphology by successive cycles of starvation, neovascularization and vessel co-option [45, 274, 528].

