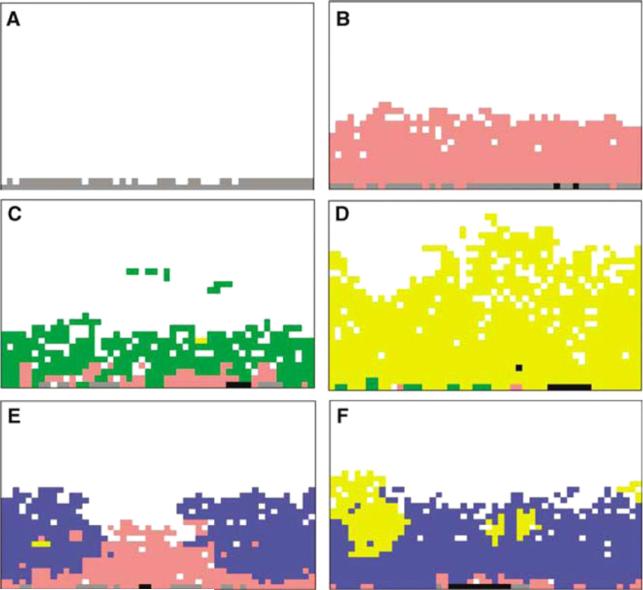
Figure 19.
Study of ductal carcinoma in situ (DCIS) using the mathematical model of Gatenby and co-workers [230] (colour online). Simulations show potential evolutionary pathways in carcinoma in situ. (a) Simulations start with a single layer of normal epithelial cells (grey cells) on a basement membrane. (b) Initial growth occurred only when mutations produced a hyperproliferative phenotype (pink cells) through mutations (in oncogenes, tumour suppressor genes, etc); growth into the lumen eventually ceased due to hypoxia and acidosis. Without additional cellular evolution, this population remains limited. Additional growth occurred following two possible sequences: (1) heritable changes that upregulate glycolysis. This population with constitutive upregulation (green cells) (c) allows this new population to replace the hyperplastic cells and to extend further into the lumen. However, clonal expansion is eventually limited by acid-mediated toxicity. This promotes evolution of a glycolytic, acid-resistant phenotype (yellow cells) which rapidly replaces all other extant populations in a highly aggressive, infiltrative pattern extending to the basement membrane and farther into the lumen (d). (2) A second pathway begins with development of an acid-resistant population (blue cells). This population expands and replaces many of the hyperplastic population (e) but growth remains limited by hypoxia promoting emergence of a phenotype with upregulated glycolysis and acid resistance (yellow cells) identical to the population in (c). Unlike in (c), this phenotype initially grows into the normoxic region forming nodules of varying size (f ), which eventually coalesce into a pattern essentially identical to the appearance in (d). Reprinted with permission from Gatenby et al Br. J. Cancer 97 649. Copyright © 2007 Nature Publishing Group.

