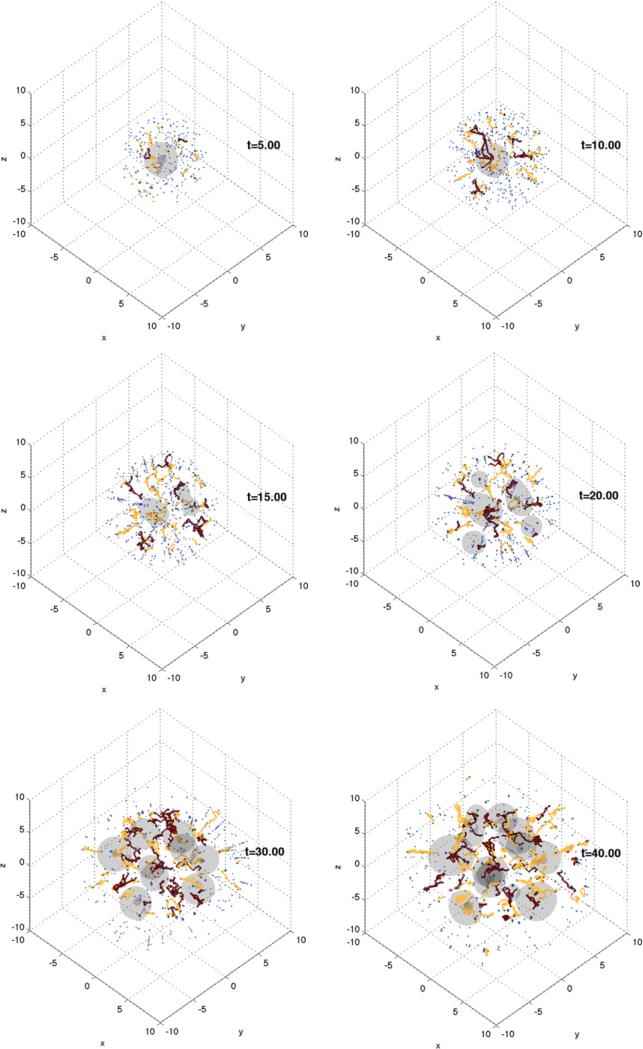
Figure 25.
Evolution of a vascularized tumour using a hybrid continuum–discrete model for tumour cells. Discrete cells (blue) dots are released from hypoxic regions of the continuous tumour regions (grey). Discrete cells are converted back to continuum volume fractions when their density is sufficiently large. Vessel sprouts (yellow) and newly formed vessels releasing oxygen (dark brown) are shown.

