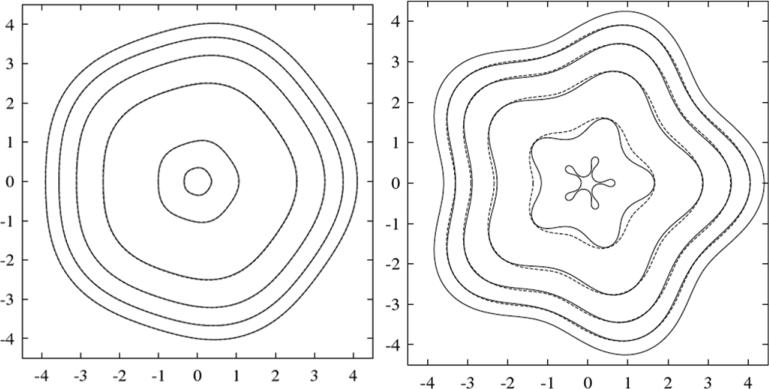
Figure 4.
Analysis of the basic tumour. Left: self-similar shrinkage for R0 = 4 and δ0 = 0.2 (t = 0 to 0.96 shown). Right: Unstable shrinkage for R0 = 4 and δ0 = 0.4 (t = 0 to 0.99). The solid curves correspond to nonlinear solution and the dashed curves to the linear. In both cases, d = 2, G = 1, l = 5 and the evolution is in the low-vascularization regime. A = A(l,G,R) given in (19) and plotted in figure 2 (top). Reprinted from Cristini et al J. Math. Biol. 46 215. Copyright © 2003 Springer. With kind permission of Springer Science and Business Media.

