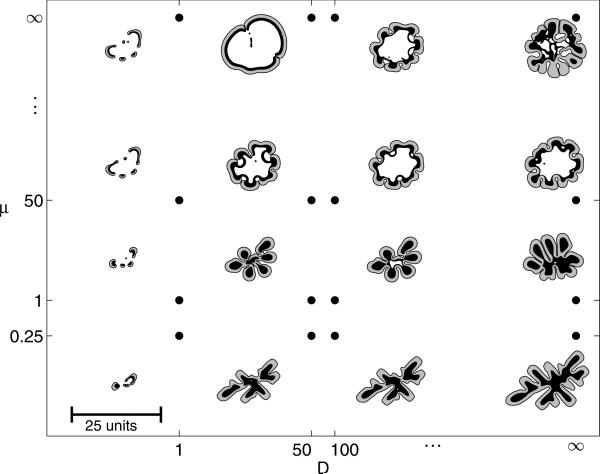
Figure 7.
Tumour morphological response to the microenvironment. The external tissue nutrient diffusivity D increases from left to right and the external tissue mobility μ increases from bottom to top. The shape of each tumour is plotted at time T = 20.0. Black regions denote ΩN where the tumour is necrotic, the grey regions show the viable tumour region ΩV and the white regions correspond to ΩH, which consists of the ECM, non-cancerous cells and any other material outside of the tumour. Three major morphologies are observed: fragmenting growth (left), invasive fingering (lower right), and compact/hollow (upper right). All tumours are plotted to the same scale, where the indicated length is 25L ≈ 0.5 cm. Reprinted with permission from Macklin and Lowengrub 2007 J. Theor. Biol. 245 687. Copyright © Elsevier.

