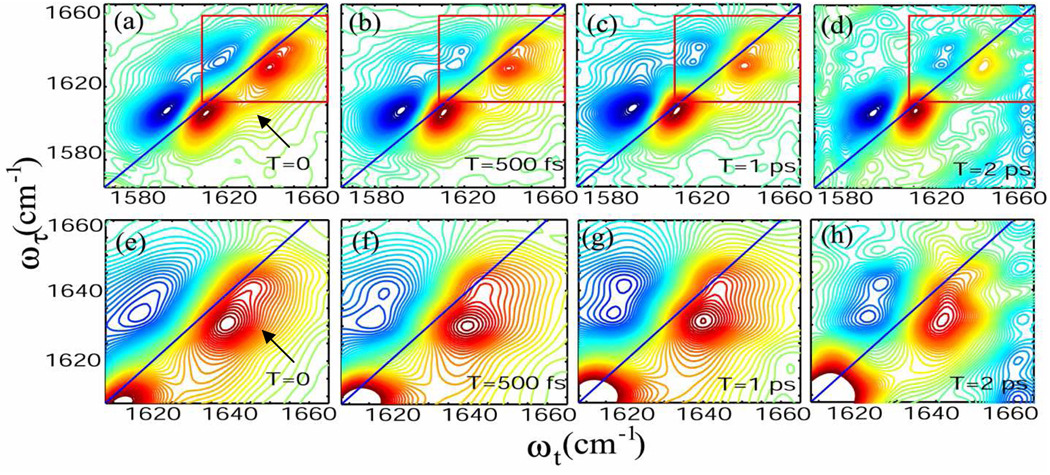
Figure 3. The 2D IR spectra of tryptophan dipeptide in D2O.
Absorptive 2D IR spectrum at (a) T = 0, (b) T = 500 fs, (c) T = 1 ps and (d) T = 2 ps. Enlargement of the frequency region of the acetyl end amide-I' mode marked by the red boxes in a, b, c, d are shown in (e) T = 0, (f) T = 500 fs, (g) T = 1 ps and (h) T = 2 ps.

