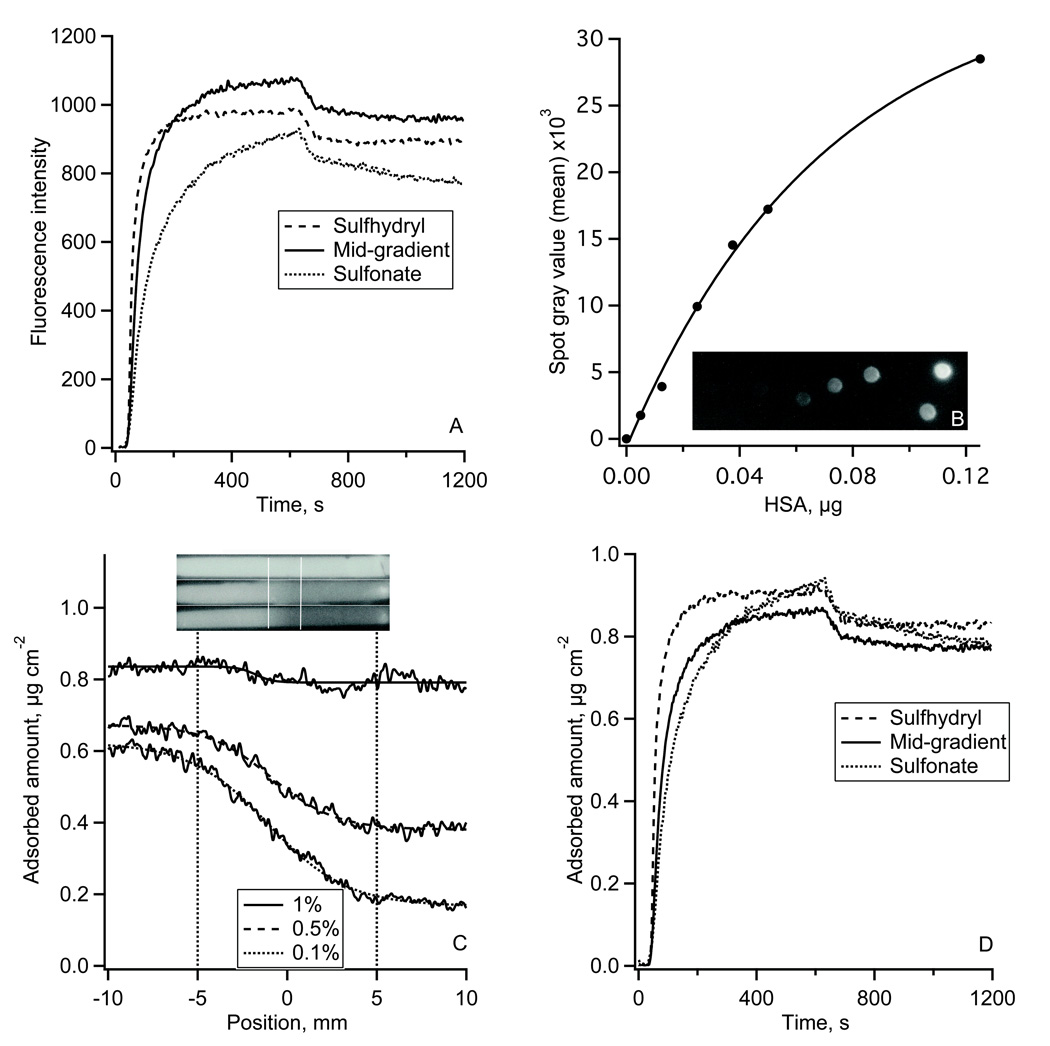
Figure 3.
The adsorption of HSA onto the gradient surface.
(A): Fluorescence intensity traces of Alexa 488-HSA adsorption-desorption kinetics measured on sulfhydryl region, gradient middle and sulfonate-containing region of the gradient in TIRF experiment.
(B): 125I-HSA autoradiography calibration spots and the calibration plot between 125I-HSA mass and the autoradiography image gray values.
(C): Adsorption of 125I-HSA along the gradient surface recorded by autoradiography at 1/100 (top), 1/500 (middle), and 1/1000 (bottom) plasma protein concentration. Top – autoradiography images of 125I-HSA adsorbed onto the whole length of a MTS modified FS slides with the gradient region in the middle of the slide as indicated. Bottom – calibrated 125I-HSA adsorption profiles along the gradient region.
(D): Alexa 488-HSA adsorption-desorption kinetics from Fig 3A calibrated using autoradiography data.

