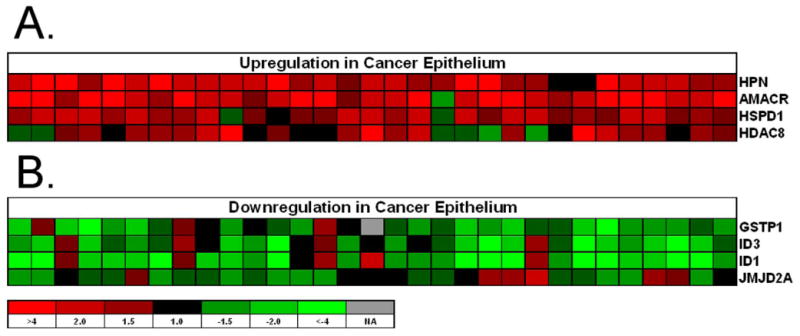
Figure 1.

The heatmap of selective genes that either have been reported to exhibit differential expression in prostate cancer (AMACR, Hepsin and GSPP1) or represent a new observation (ID1 JMJD2A). A, upregulation. B, downregulation. Red: upregulated in tumor; Green: downregulated in tumor. Row: genes; Column: patients.
