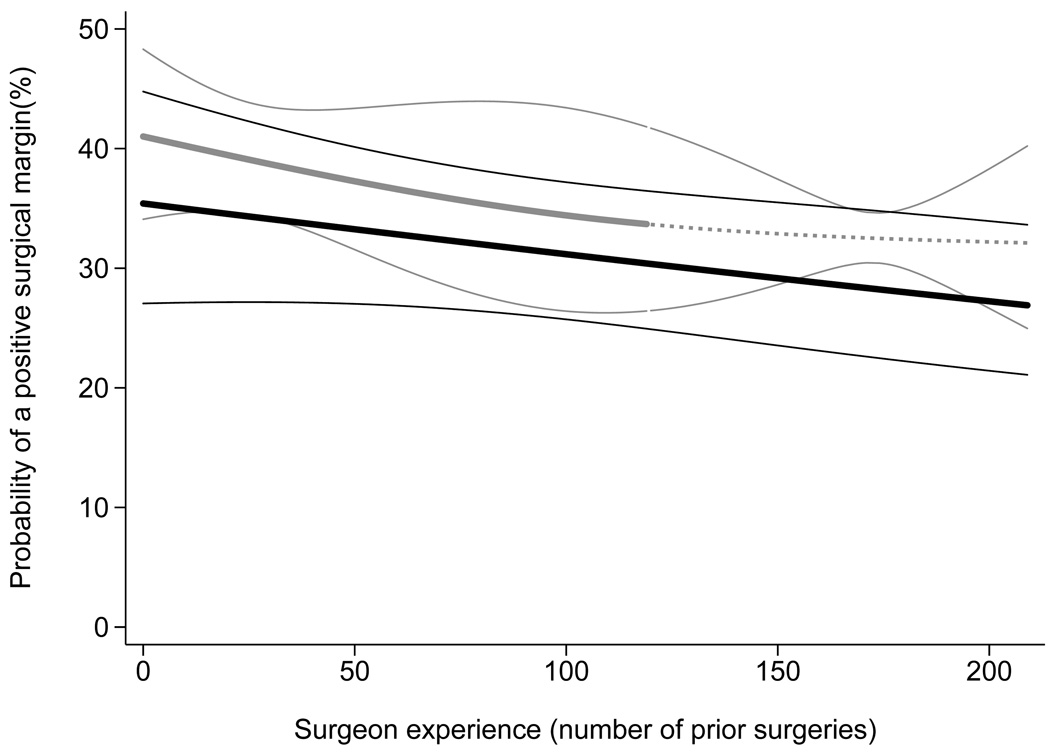
Figure 2. The learning curve for positive surgical margins, separately for surgeons with and without fellowship training, with 95% confidence intervals.
Predicted probability of a positive surgical margin, calculated from a statistical model, is plotted against surgeon experience. Probabilities are for a patient with typical cancer severity in the entire cohort of 7765 (mean PSA, pathological stage and grade). Black lines: fellowship trained; Gray lines: non-fellowship trained. The dashed gray line is for the single non-fellowship trained surgeon with greater than 120 surgeries. The confidence intervals are given by thin black and gray lines.

