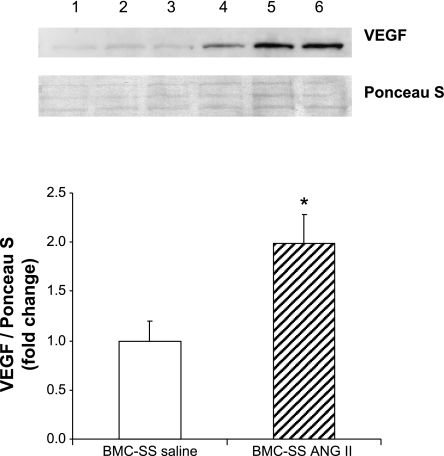
Fig. 3.
Representative Western blot (top) and corresponding quantitative densitometry (bottom) of VEGF expression in the whole BMC of SS/Mcwi rats infused with saline (lanes 1–3) or ANG II (lanes 4–6). The VEGF protein expression is presented as relative (fold change) to BMC-SS saline (control = 1). *P < 0.05 vs. BMC-SS saline. Data are presented as means ± SE. BMC-SS saline (n = 5), BMC-SS ANG II (n = 6).

