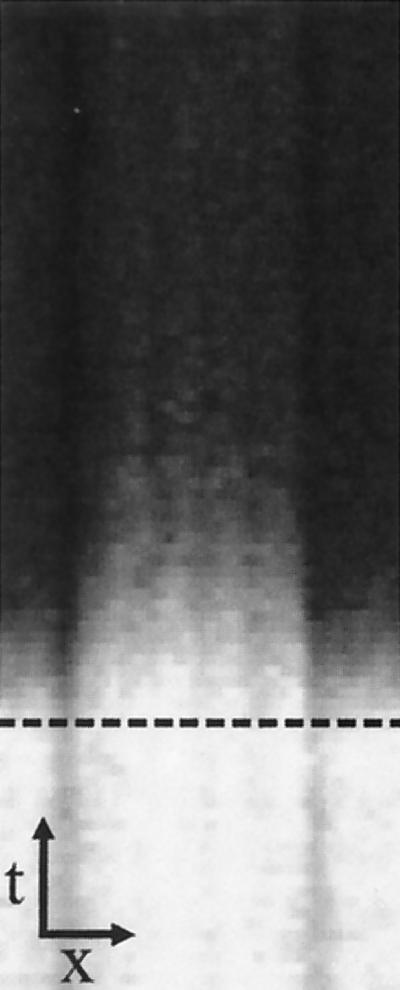
Figure 3.
Spatiotemporal CARS recording of a single cell that is initially immersed in aqueous medium and subsequently flushed with isotonic D2O medium. The dashed line indicates the moment at which the perfusion chamber is flushed. Shaded horizontal lines correspond to the position of the plasma membrane. Arrows, 3 μm (horizontal, x), 1.5 s (vertical, t).

