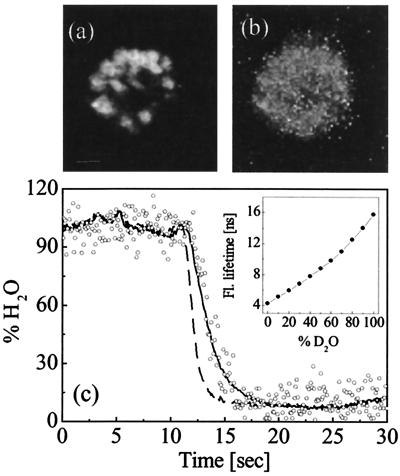
Figure 6.
TPE fluorescence of D. discoideum that have been labeled with ANTS. (a) TPE fluorescence intensity image. Fluorescent probe is accumulated in cytosolic vesicles. (Bar = 2 μm.) (b) Fluorescence lifetime image of the same cell. Average lifetime is determined to be 4.5 ns, corresponding to an aqueous environment. (c) Simultaneous measurement of total intracellular CARS signal (solid line) and lifetime change of the ANTS fluorophore (dots) during a flushing event. Dashed line indicates the response time of the perfusion chamber. Inset shows the change in TPE fluorescence lifetime of a 10 mM ANTS solution for different volume fractions of D2O relative to H2O.

