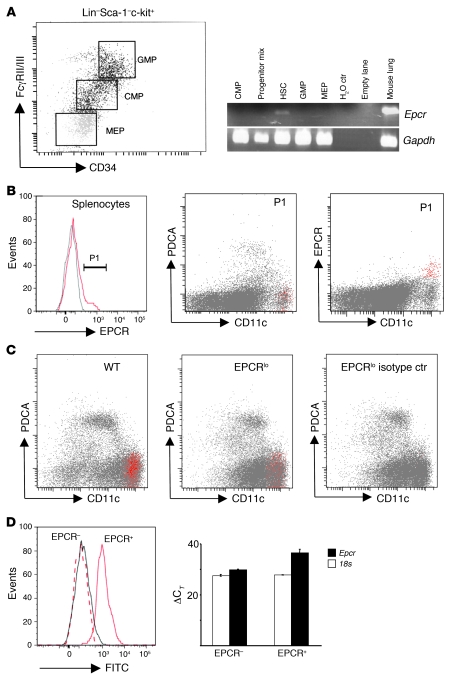
Figure 2. EPCR is expressed in HSCs and spleen DCs.
(A) Whole BM from 10 wild-type mice was pooled and fractionated by FACS into HSCs (Lin–Sca-1hic-kithi; Lin: CD3ε, CD4, CD8a, CD19, Ly6G, CD45R), granulocyte-macrophage progenitors (GMP: Lin–Sca-1–c-kit+CD34+FcRγII/IIIhi), common myeloid progenitors (CMP: Lin–Sca-1–c-kit+CD34+FcRγII/IIIlo), megakaryocytic erythroid progenitors (MEP: Lin–Sca-1–c-kit+CD34–FcRγII/IIIlo), or a progenitor mix (CMP, GMP, MEP, CLP: Lin–Sca-1–c-kitlo/–). Epcr and Gapdh mRNA were amplified by 35- and 30-cycle RT-PCR, respectively, from RNA isolated from sorted cell pools. (B) Detection of EPCR expression in wild-type splenocytes. Back-gating of EPCR-positive cells (gate P1, gray line indicates signal obtained with isotype control antibody) shows EPCR expression in CD11chiPDCA-1– DCs (red). (C) Abundance of EPCR-expressing CD11chiPDCA-1– DCs is diminished in EPCRlo mice. Spleen DCs were enriched by capture on CD11c/PDCA-1 magnetic beads and analyzed for EPCR expression as in B. (D) Detection of EPCR surface expression captures the majority of DCs expressing Epcr mRNA. Spleen DCs were enriched on magnetic beads as in C, and EPCR+ cells were isolated by FACS via gating on CD11chiPDCA-1– DCs, followed by sorting into EPCR+ and EPCR– CD11chiPDCA-1– cells (left panel, solid gray line: isotype control on post-sort EPCR+ cells; dotted red line: FITC intensity of post-sort EPCR-depleted CD11chiPDCA-1– cells; solid red line: FITC intensity of post-sort EPCR+ CD11chiPDCA-1– cells). Quantitative RT-PCR analysis of Epcr mRNA on sorted cells shows depletion of Epcr mRNA in cells lacking EPCR surface expression as detected by flow cytometry (right panel; bars indicate the average ± SD of the detection threshold expressed as the ΔCT value for Epcr mRNA determined in 2 independent sorting experiments, with 3 measurements/sample).

