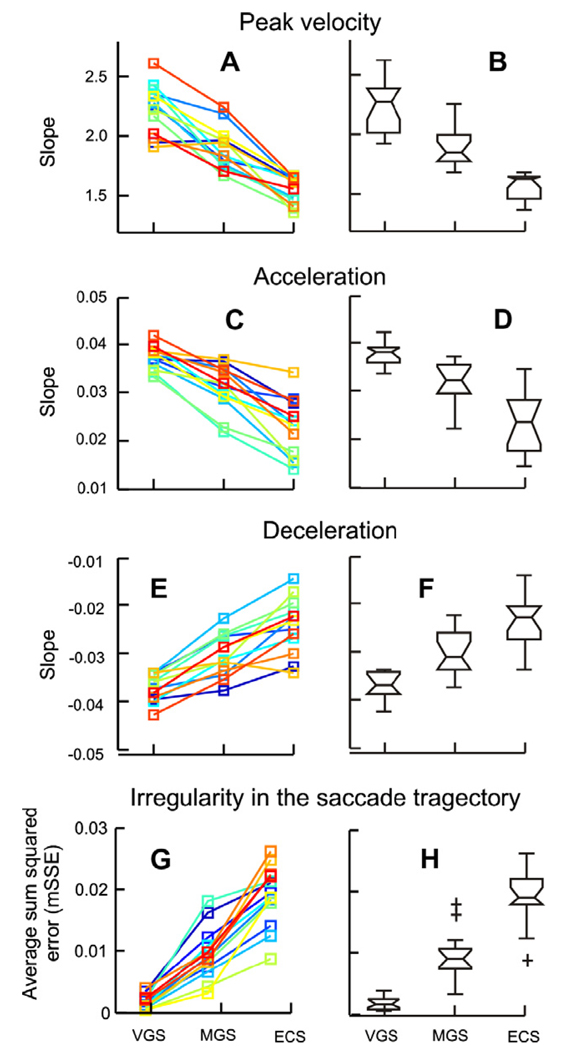
Fig. 3.
(A) Summary of the slopes of the fitted main-sequence equation in all subjects (visually guided saccade = VGS, memory guided saccade = MGS, saccade with eyes closed = ECS). Each of the three conditions is sorted along the x-axis and the corresponding slope is plotted along the y-axis. Each color depicts one subject. (B) Box and whisker plots summarize the slopes of the fitted main-sequence equation in all subjects. The horizontal line in the center of the notch represents the median slope; the notches represent the 95% confidence interval; the length of the box represents the inter-quartile difference; and the whiskers depict the range. Non-overlapping notches of the box-whisker plot suggest that the corresponding median values are significantly different (one-way ANOVA, p < 0.05). Plus symbols represent outliers. (C) Summary of slopes of the linear fit to the relationship between the peak acceleration and peak velocity. (E) Summary of the slopes of the linear fit to the relation between peak deceleration and the peak velocity. (D and F) Box and whisker plots representing the statistically significant effect of eye closure on the slopes. (G) Summary of goodness-of-fit of the fitted elliptical function to the phase plane trajectory during the three conditions and the summary of their statistics (H).

