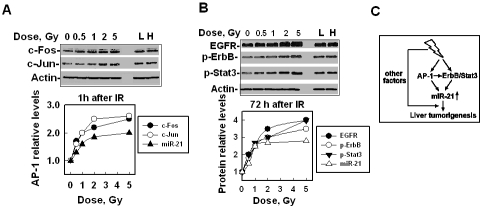
Figure 6.
The effects of IR with different doses on AP-1, ErbB/Stat3 and miR-21 expression/activation. (A) The levels of AP-1 (c-Fos and c-Jun) or miR-21 in LO2 cells at 1 h after different doses of IR exposure. L and H are the same as described in Figure 3. Top panel: the image from Western blot. Bottom panel: analysis of the protein levels shown in the top panel by ImageQuant. The miR-21 level was measured by qRT-PCR. (B) The levels of EGFR, phosphorylated ErbB or Stat3 and miR-21 in LO2 cells at 72 h after different doses of IR exposure. L and H are the same as described above. Top panel: the image from Western blot. Bottom panel: analysis of the protein levels shown in the top panel by ImageQuant. The miR-21 level was measured by qRT-PCR. (C) A summary of the effects of IR-promoted liver carcinogenesis is as follows: IR stimulates miR-21 expression through the up-regulation or activation of AP-1 (at an earlier time) and ErbB/Stat3 (at a later time) pathways. AP-1 could also directly or indirectly activate the ErbB/Stat3 pathways. The over-expression of miR-21 promotes liver tumorigenesis and other IR-stimulated factors that may also facilitate the function of miR-21 and contribute to liver tumorigenesis.

