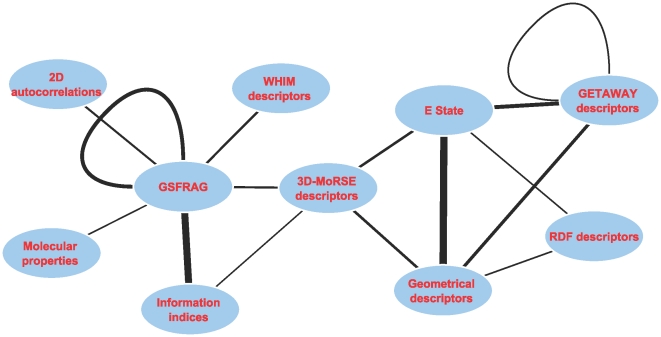
Figure 4. Visual summary of descriptor connections.
The network represents the number of interactions between PCFs descriptor groups computed from pooled models. The thickness of the line is proportional to the number of pathways in which PCFs of a given descriptor group are selected in an interaction component of a predictive models. The highest value edge is found between ET-State and Geometrical descriptors in which 11 out of 19 pathways were found to contain models based on features from these 2 descriptor groups.

