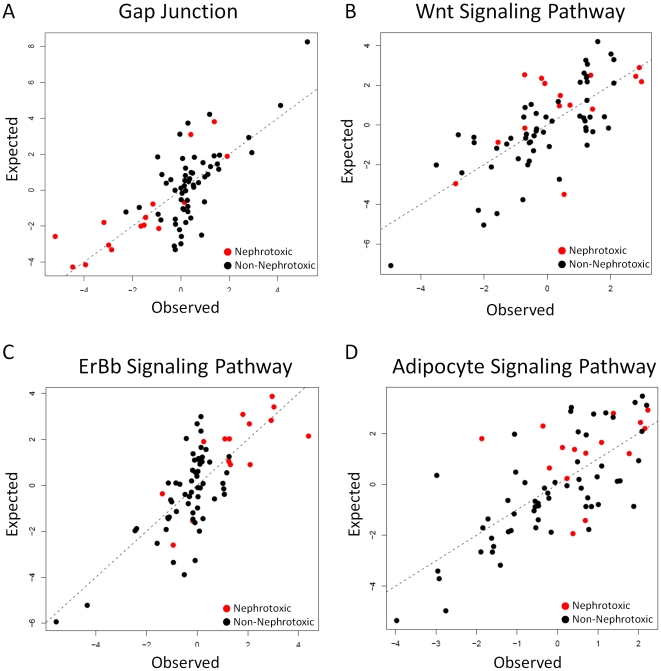
Figure 5. Example models linking PCFs with molecular pathway activity.
The figure shows the relationships between the observed (x axis) and predicted (y axis) indices of pathway activity for a number of exemplar KEGG pathways. Nephrotoxic samples are represented by red dots whereas non-nephrotoxic samples are represented by black dots. Gap Junction and ErbB Signaling Pathway contain features belonging to ET-State indices, Geometrical descriptors and RDF descriptors. The  values are 0.55 and 0.57 respectively. Wnt Signaling Pathway and Adipocyte Signaling Pathway contain features belonging to GSFRAG, Information indices, Edge adjacency indices and 3D-MoRSE descriptors. The
  values are 0.52 and 0.51 respectively. Note that models containing a feature from E-State indices and RDF descriptors better separate nephrotoxic and non-nephrotoxic samples.

