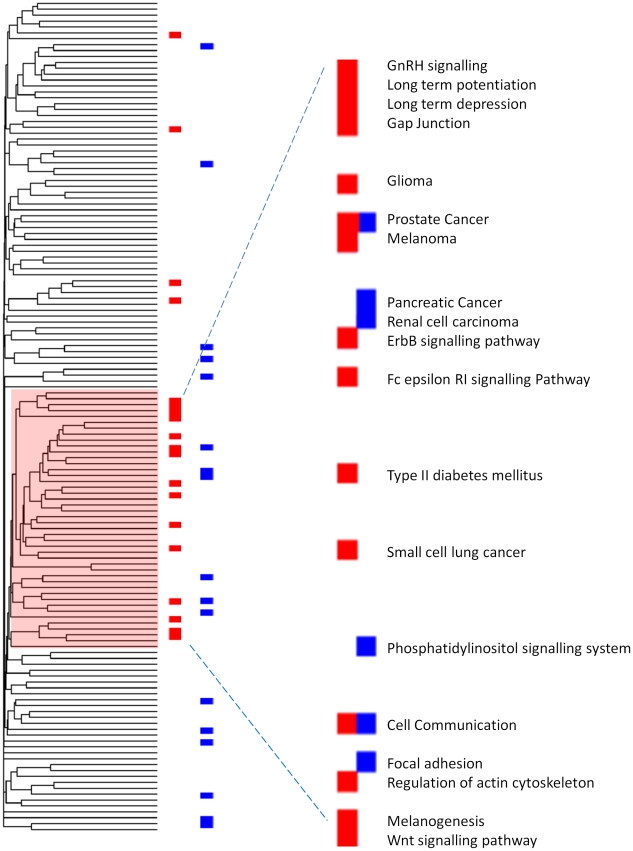
Figure 6. KEGG Pathway topology map.
The Figure shows a dendrogram representing the degree of similarity between different KEGG pathways. Pathways marked in red are pathways that were found to be associated to chemical features (19), and pathways marked in blue have been found to be predictive of toxicity (21). Pathways whose activity is predicted by PCFs group in a tight cluster. Note that the majority of toxicity annotated pathways cluster towards the lower half of the dendrogram, close to pathways linked to PCFs.

