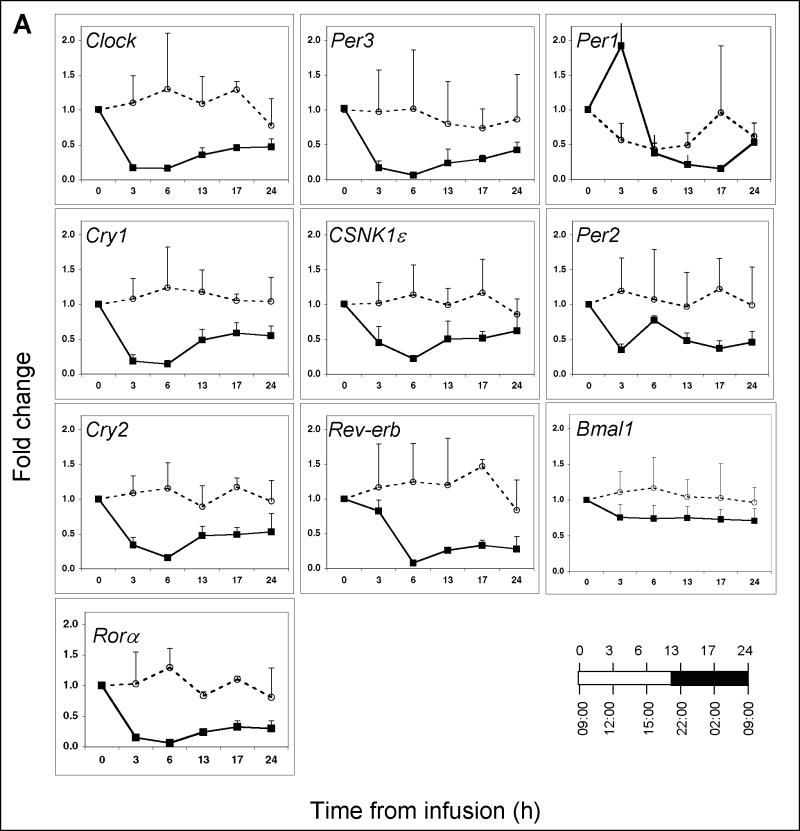
Figure 1. Clock gene expression in peripheral blood leukocytes obtained from human subjects challenged with endotoxin or saline at 09:00 h.
(A) Blood was collected at the indicated time points post-endotoxin (closed symbols; n=4 subjects) or post-saline (open symbols; n=2 subjects) infusion. Gene expression levels were analyzed by qRT-PCR and are expressed as fold change relative to the 09:00 h infusion time, taken to be time 0. The relationship between the time from infusion and the time-of-day is illustrated in the lower right hand corner. Data are expressed as mean fold change ± SD. (B) Plasma cortisol levels (n=4) as a function of time post-endotoxin were monitored by direct radioimmunoassay. (C) TNFα (n=4) and (D) IL-6 (n=4) levels were determined by enzyme-linked immunoassay.


