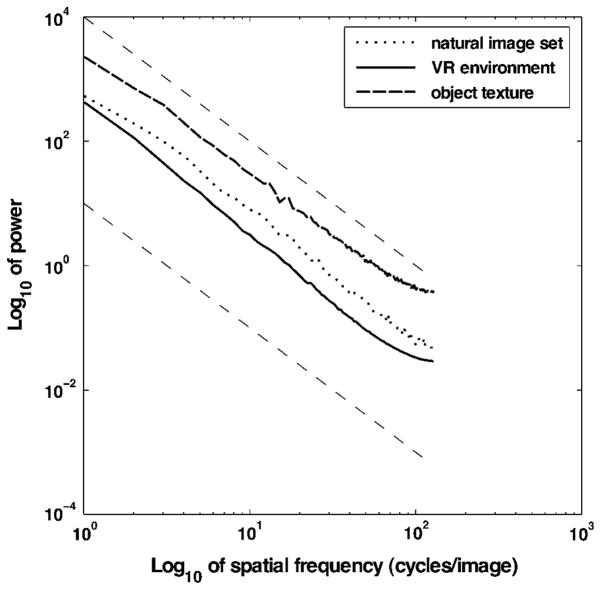
Fig. 3.
Log–log plot of the rotational averages of the estimated power spectra for different image sets. The curves correspond to the slope of the rotational average of the power spectra as estimated using Bartlett’s method for a set of natural images, the object texture in the VR experiments, and multiple views from the subjects perspective in the VR experiments. Slopes of −2 corresponding to 1/f 2 envelopes are shown as dashed lines.

