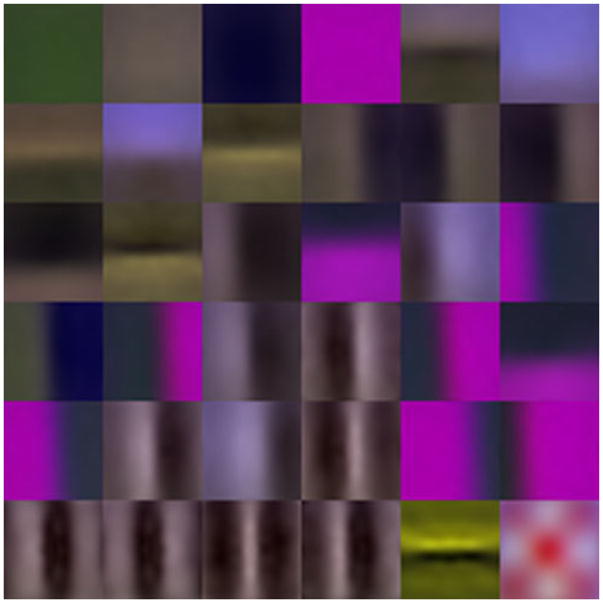
Fig. 8.

The set of 36 cluster centers obtained from the image representation using the Gabor filters. These image patches are obtained by reprojecting the model simple cell responses at the center of the 36 clusters back into image space. These patches can be regarded as a set of features that can be utilized in representing the vast majority of image patches in the scenes of the visual world of the experiment. The patches are sorted in descending order of their relative frequency in all considered scenes from the top left corner to the bottom right corner.
