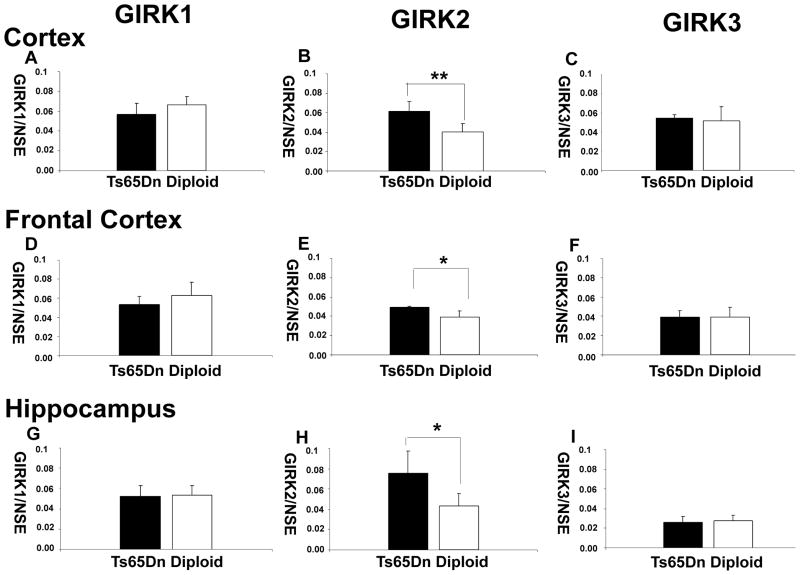
Fig. 2.
Real time RT-PCR analysis of GIRK1 (A, D, G), GIRK2 (B, E, H) and GIRK3 (C, F, I) expressions in Ts65Dn (solid bars; N = 5) and diploid littermate (open bars; n = 5) cortex (A, B, C), frontal cortex (D, E, F) and hippocampus (G, H, I). GIRK2 mRNA was over-expressed in cerebral cortex (1.5-fold, P<0.001), frontal cortex (1.3-fold, P=0.017) and hippocampus (1.7-fold, P=0.012) compared to diploid littermates. The expression levels of GIRK1 and GIRK3 mRNAs were not significantly different between Ts65Dn and diploid littermates in all brain areas. Results are mean ± SEM. 0.01 ≤≤ *P < 0.05, **P < 0.01, significantly different from diploid littermates.

