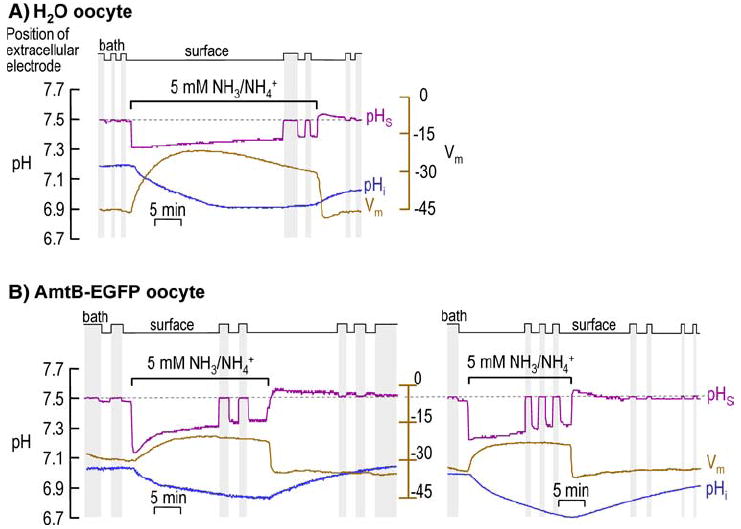
Fig. 2.

Intracellular pH (pHi) and surface (pHS) records during application and removal of 5 mM NH3/NH4+. a H2O-injected oocyte. b AmtB EGFP-tagged expressing oocytes. At the indicated times, we switched the extracellular solution from ND96 to 5 mM NH3/NH4+ and then back again. b shows two representative experiments: on the left, pHS at first decays rapidly and then more slowly, whereas on the right, pHS decays slowly throughout the NH3/NH4+ exposure. In both a and b, the purple record is pHS, the blue record is pHi, and the brown record is Vm. The vertical gray bands represent periods during which the pHS electrode was moved to the bulk ECF for calibration (fixed pH of 7.50). In H2O oocytes, mean pHi was 7.10 ± 0.04 before and 6.84 ± 0.06 during exposure to 5 mM NH3/NH4+ (n = 6; p = 0.005); the comparable mean Vm values were −43 ± 2 and − 25 ± 2 mV (n = 6; p = 0.0002). In AmtB oocytes, the mean pHi was 7.14 ± 0.04 before and 6.98 ± 0.06 during exposure to 5 mM NH3/NH4+ (n = 8; p = 0.037); the comparable mean Vm values were −38 ± 4 and −26 ± 2 (n = 8; p = 0.010)
