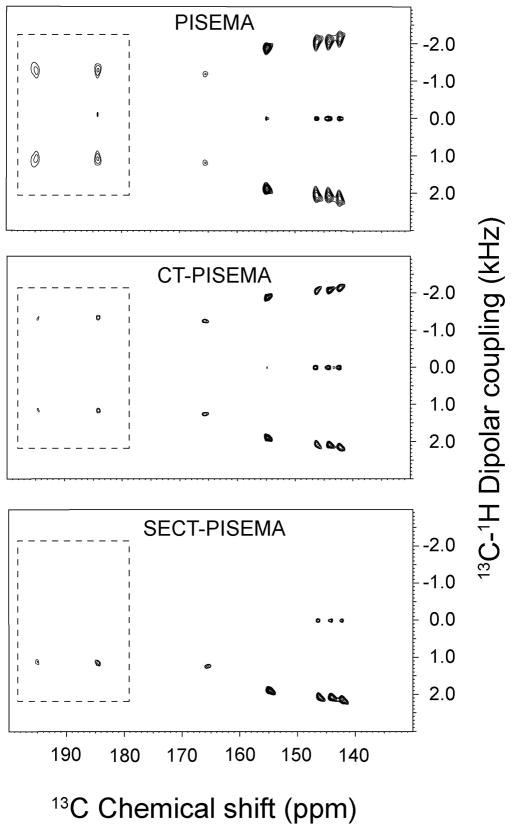
Figure 3.
Comparison of the 2D spectra of PISEMA, CT-PISEMA, and SECT-PISEMA experiments acquired with 21 t1 increments. For SECT-PISEMA the τ period was set to 125 μs. The 13C carrier frequency was set to 162 ppm. All the spectra were processed with linear prediction of t1 signal up to 128 points. 90° shifted sine bell window function is applied in both dimensions. The scale of the dipolar dimensions was corrected according to a theoretical factor of 0.82. All of the spectra were plotted with the same scale. The intensities of the peaks in the dotted boxes are multiplied by a factor of 2. The comparison of both resolution and sensitivity for these experiments are reported in Tables 1 and 2, respectively.

