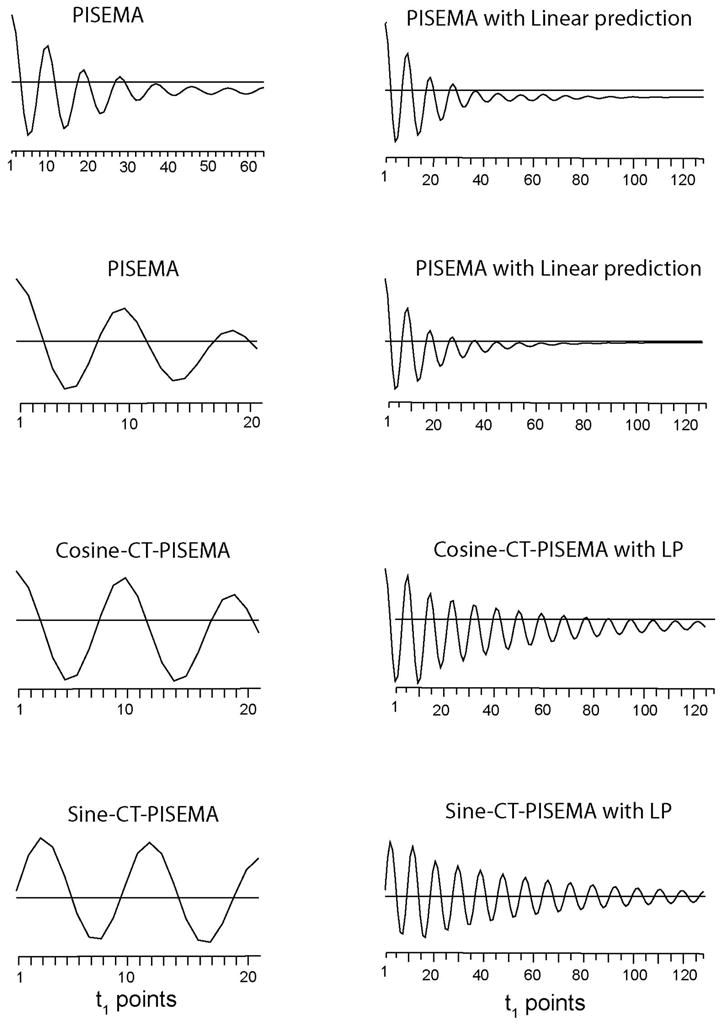
Figure 5.

Dipolar oscillations (t1 signal) for 13C resonance ‘2’ from the PISEMA and SECT- PISEMA experiments reported in Figures 2 and 3. Left panel shows the experimental FID from the t1 dimension, right panel shows the corresponding FID from the t1 dimension obtained by forward linear prediction of 128 points.
