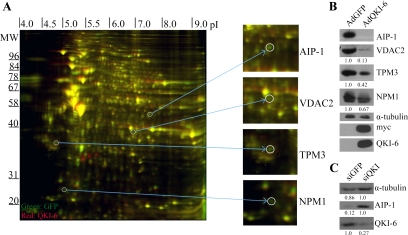
Figure 1.
Two-dimensional DIGE identifies QKI-6–regulated targets in glioblastoma cells. (A) The differential protein expression between AdGFP-infected and AdQKI-6–infected CRL2020 cells was identified by 2D-DIGE. The unique protein spots (green or red, not yellow) were picked and identified by mass spectrometry. The molecular mass markers are shown on the ordinate in kilodaltons, and the isoelectric point is shown on the abscissa. Four representative unique spots were enlarged on the right, which were identified via mass spectrometry as AIP-1, VDAC2, TPM3, and NPM1. (B) Protein extracts from AdGFP and AdQKI-6 were analyzed by SDS-polyacrylamide gel electrophoresis followed by immunoblotting with anti-AIP-1, -VDAC2, -TPM3, and -NPM1 antibodies. Anti-α-tubulin antibodies were used to confirm equivalent protein expression. Anti-myc and -QKI-6 antibodies confirmed the expression of the myc-epitope–tagged QKI-6. The data shown are representative of three independent experiments and normalized to α-tubulin protein levels. The relative amounts are presented underneath each blot and were performed using Scion-Image (Scion, Frederick, MD). The standard deviations for VDAC2, TPM3, and NPM1 are ±0.1, ±0.12, and ±0.09, respectively. (C) Knockdown of QKI-6 was performed using siRNA against QKI or control siRNA against GFP. Protein extracts from siQKI and siGFP were analyzed by SDS-PAGE followed by immunoblotting with anti-AIP-1 and -QKI-6 antibodies. Anti-α-tubulin antibodies were used to confirm equivalent protein expression. Absolute quantified levels of protein bands are presented underneath each blot and were performed using Scion-Image.

