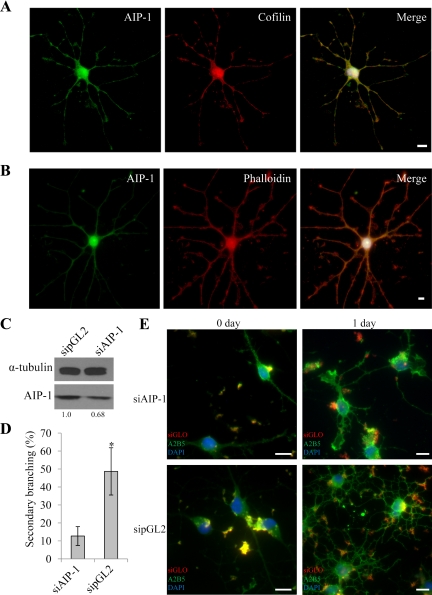
Figure 8.
AIP-1 depleted OLs exhibit defects in process extension. Primary rat OPCs were differentiated for 1 d. The cells were then immunostained for AIP-1 and cofilin (A) or AIP-1 and phalloidin (B); the nuclei were visualized with 4,6-diamidino-2-phenylindole (DAPI) staining, and the images were merged on the right. Bars, 50 μm for the full images and 25 μm for the branch point images. (C) Knockdown efficiency of AIP-1 was verified using Western blotting from total cell lysates extracted after 24 h of differentiation, and α-tubulin was used as a loading control. Changes in AIP-1 levels are shown and represent α-tubulin normalized values; quantifications were performed using Scion-Image. (D) Day 1 differentiated cells transfected with either siAIP-1 or sipGL2 were quantified for their differentiation progress by counting the number of secondary branching positive cells in five fields of view per triplicate. One-way analysis of variance was performed; single asterisk denotes a p < 0.05. (E) Primary rat OPCs were cotransfected with siRNAs targeting AIP-1 or an irrelevant gene (luciferase; sipGL2) and siGLO, a marker of transfected cells. The siRNA-incubated cells were left in proliferation media (day 0) or induced to differentiate for 24 h, and the cells were then immunostained with anti-A2B5 antibodies to monitor process outgrowth. Bars, 50 μm.

