
Figure 1.
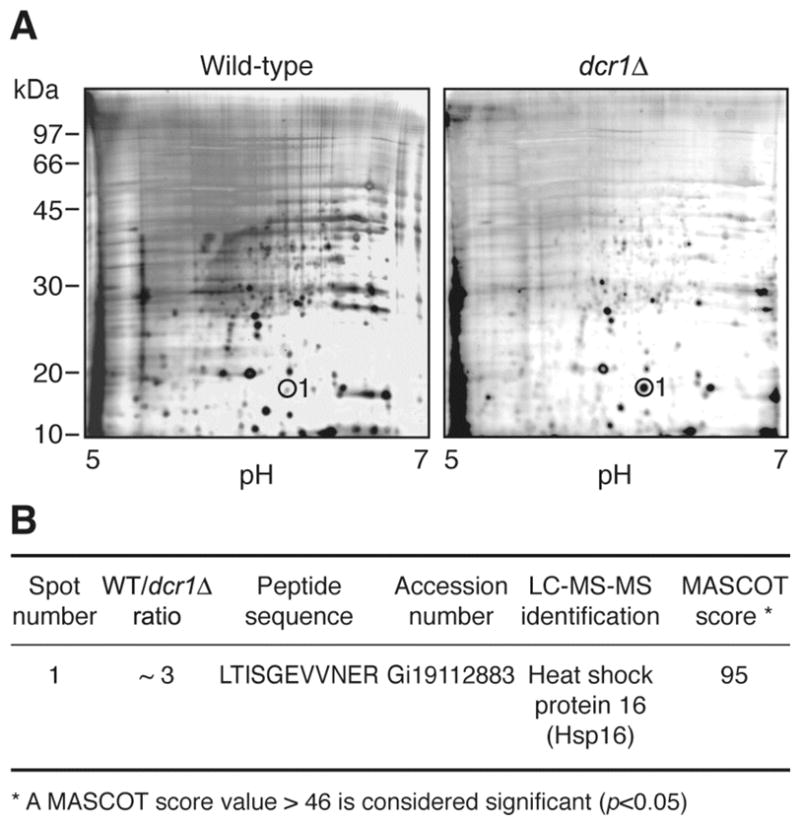
Comparative two-dimensional gel analysis of the WT and dcr1Δ strains using silver staining. (A) Gels showing the protein profiles of Hu303 (WT, left panel) and Hu676 (dcr1Δ, right panel) strains. Protein extracts were separated on an IPG band covering pH 5.0 to 7.0 (first dimension), migrated on a denaturing 10% polyacrylamide gel (second dimension) and stained with silver nitrate. (B) Results of the proteomic analyses. The relative intensity of the spot was estimated. Spot number 1 (circled) was cut from the gels and identified by LC-MS-MS.