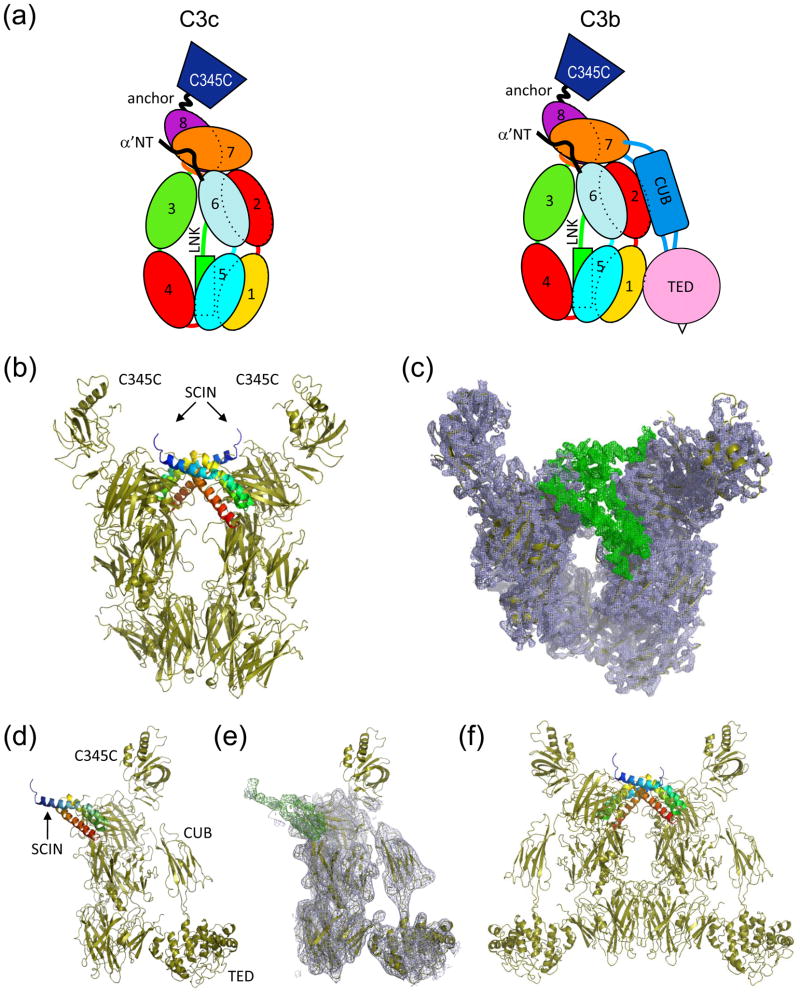
Figure 1. Crystal structures of complement fragments C3c and C3b bound to SCIN.
(a) Schematic representation of the domains which comprise C3c and C3b. (b) Crystal structure of C3c-SCIN (drawn from RCSB code 3NSA), where two copies of SCIN (blue to red rainbow from amino to carboxy terminus) and two copies of C3c (sand) are found in the asymmetric unit. (c) Electron density map of the same structure generated by refinement of models not containing SCIN molecules. 2Fo−Fc density (blue cage; 1.5σ contour) fits two copies of C3c, while the Fo−Fc map (green cage; 2.0σ contour) shows clear positive density corresponding to the location of the SCIN polypeptide. Note that the viewing plane of this panel is inclined slightly relative to panel b for clarity. (d) Crystal structure of C3b-SCIN, where a single copy of both SCIN (blue to red rainbow from amino to carboxy terminus) and C3b (sand) are present in the asymmetric unit. (e) Electron density map of the same structure generated by refinement of the model without the SCIN polypeptide. Map parameters are identical to those in panel c. (f) Generation of the symmetry mate (x,y,−z) from the C3b-SCIN crystal indicates a mode of tetramerization similar to that seen in all C3c-SCIN structures (please see Supplemental Figure 1).

