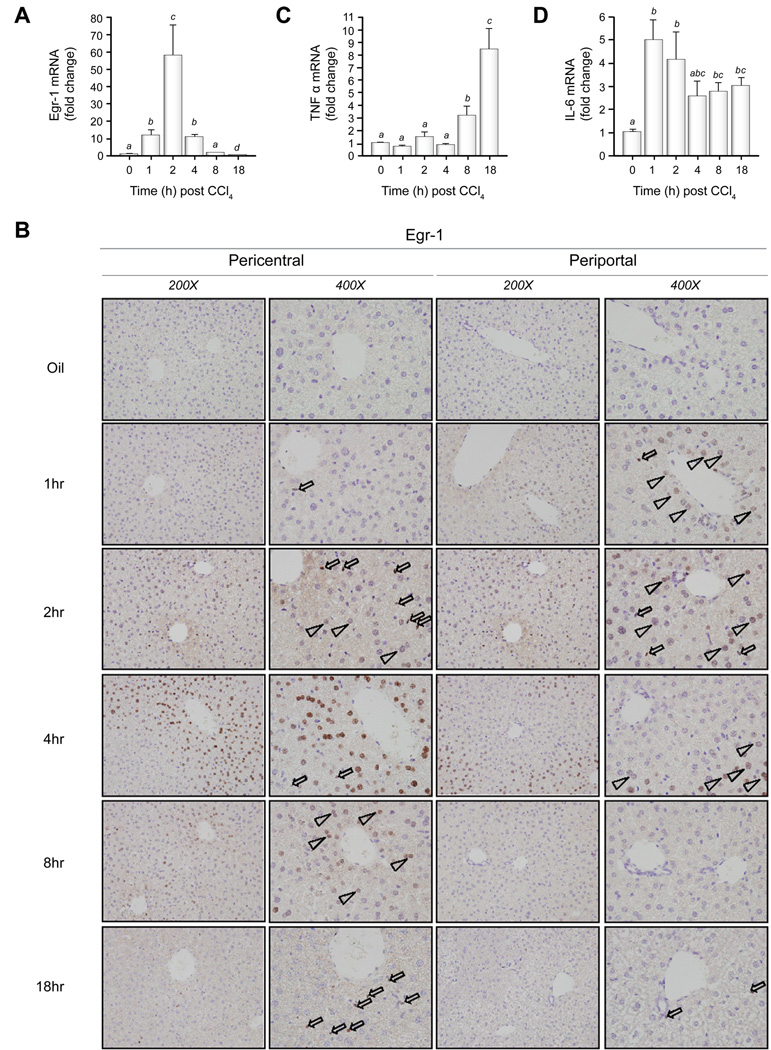
Fig. 3. Egr-1, TNFα, and IL-6 expression after CCl4 exposure in wild-type mice.
Real-time PCR was utilized to determine mRNA accumulation of (A) Egr-1 (C) TNFα and (D) IL-6. Bars represent means +/− SEM of n = 4 – 6 mice per experimental condition. (B) Immunohistochemistry was used to localize Egr-1 protein in liver sections. Open arrowheads indicate Egr-1-positive hepatocyte nuclei, open arrows indicate Egr-1-positive nuclei in NPC-HS. Images are representative of n = 4 mice for each experimental condition

