
Figure 6.
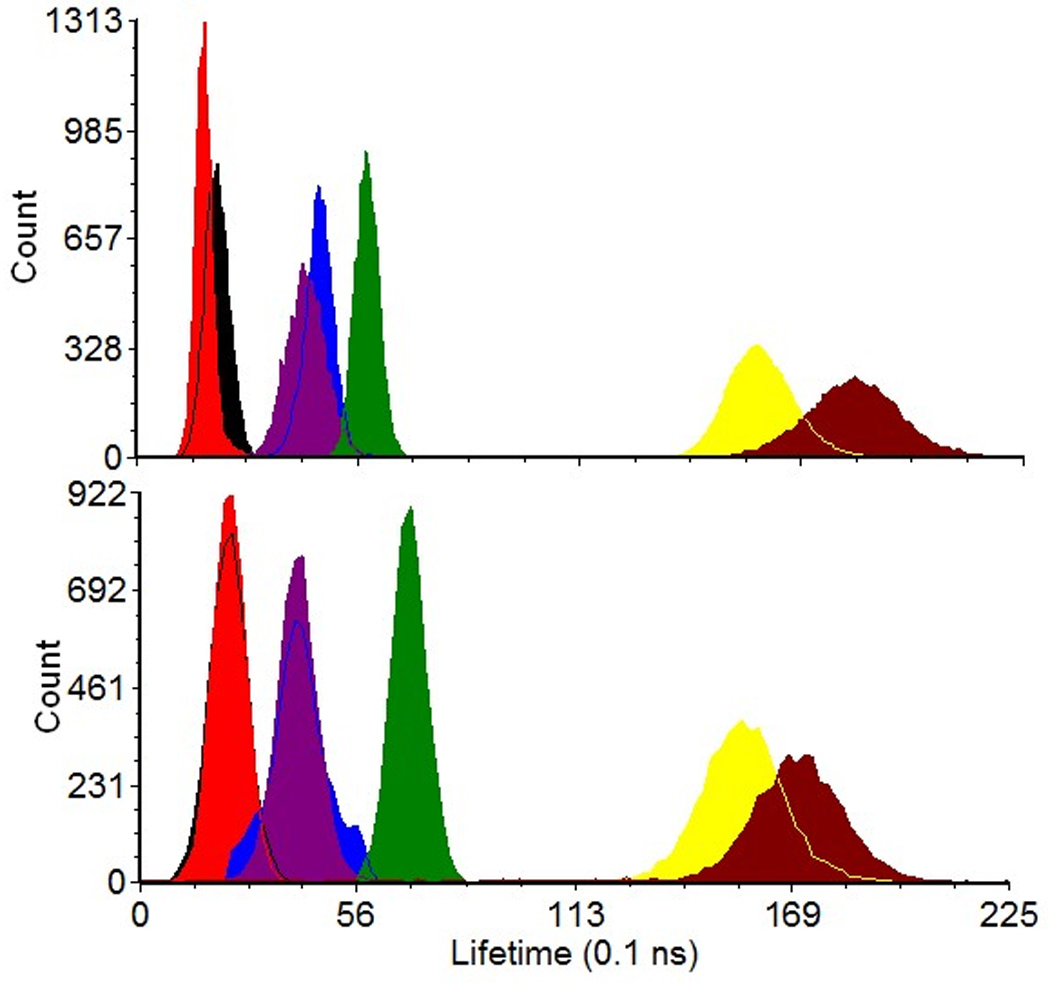
Lifetime results from cell and fluorescence microspheres acquired on an analog (A) and digital (B) version of the PSFC system. The black, red, blue, purple, green, yellow, and maroon histograms represent lifetime results for 2 µm yellow-green microspheres, 6 µm yellow-green microspheres, 8-peak Spherotech™ rainbow microspheres, Syto9-stained CHO cells, Flow-Check™ microspheres, propidium iodide-stained CHO cells, and ethidium bromide-stained CHO cells, respectively.