
Figure 7.
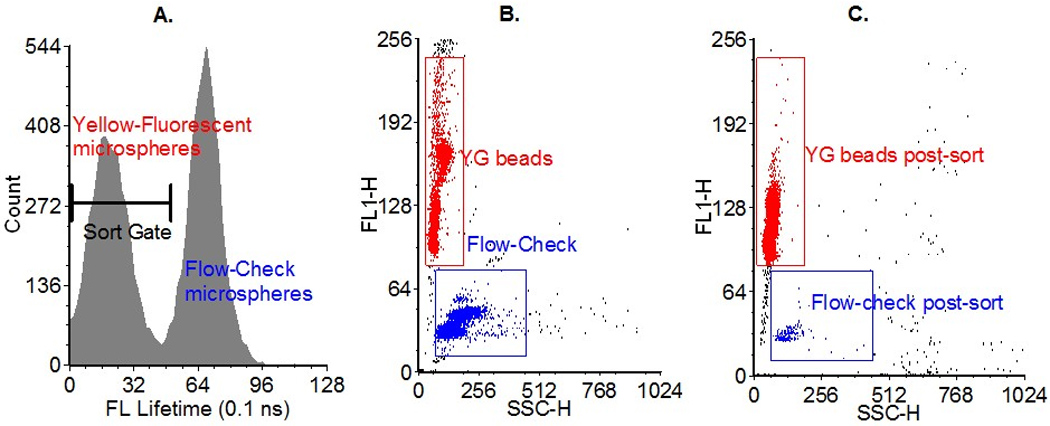
A) Fluorescence lifetime histogram acquired with the digital lifetime data system. One of the three gates adjusted in TRAViS is displayed and positioned such that the bead population with the shorter lifetime was selected. B) Dot plot of the initial bead mixture, showing an approximately equal mixture of yellow-green (red gate) and Flow-Check™ microspheres (blue gate). The red gate includes 42% of all events detected and the blue gate includes 54% of all events detected. C) Dot plot of the post-sorted mixture. The red gate includes 96% of all events detected and the blue gate includes 1.6% of all events detected, which resulted in a purity of sort of approximately 98%.