
Figure 1.
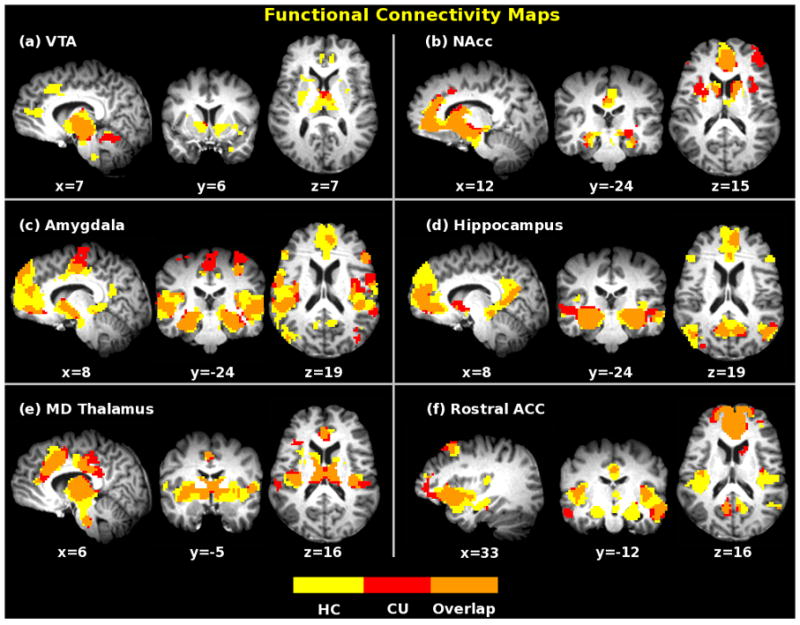
Functional connectivity maps of six MCL seeds for healthy controls (yellow) and cocaine users (red) under resting state (pcorrected < 0.001, with t(38) > 3.8 and a cluster size of 38 voxels). Maps were overlaid together for display purpose. Orange color indicates overlapped areas for both groups.