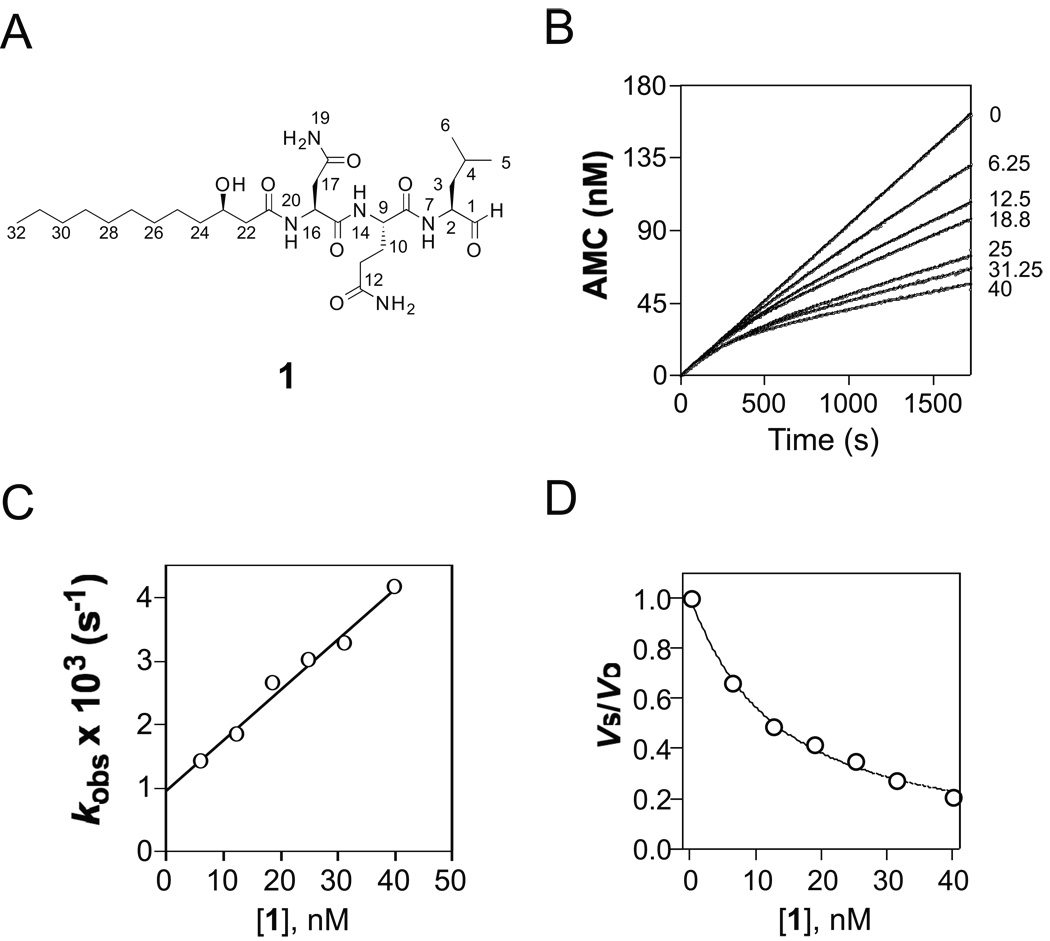
Figure 1.
Inhibition of Mtb proteasome by fellutamide B (1)
A) Structure of 1. B) Reaction progress curves of cleavage of Suc-LLVY-AMC by Mtb proteasome in the absence and presence of 1 at 6.25 nM – 40 nM; the curves were fit by nonlinear regression to equation (1) to determine the apparent first-order rate constant kobs values, which were corrected by equation (2) to yield real kobs. C) Dependence of kobs on inhibitor concentration. The solid line was drawn by fitting the data to equation (3), yielding kon = (129 ± 0.8) × 103 M−1s−1, and koff = (0.96 ± 0.13) × 10−3 s−1. D) Plot of vs/vo versus inhibitor concentration. The data were fitted to equation (4), yielding Ki = 6.8 ± 0.2 nM.

