
Figure 3. Surface plasmon resonance (SPR) analysis of the interaction of importin α5 with pSTAT1.
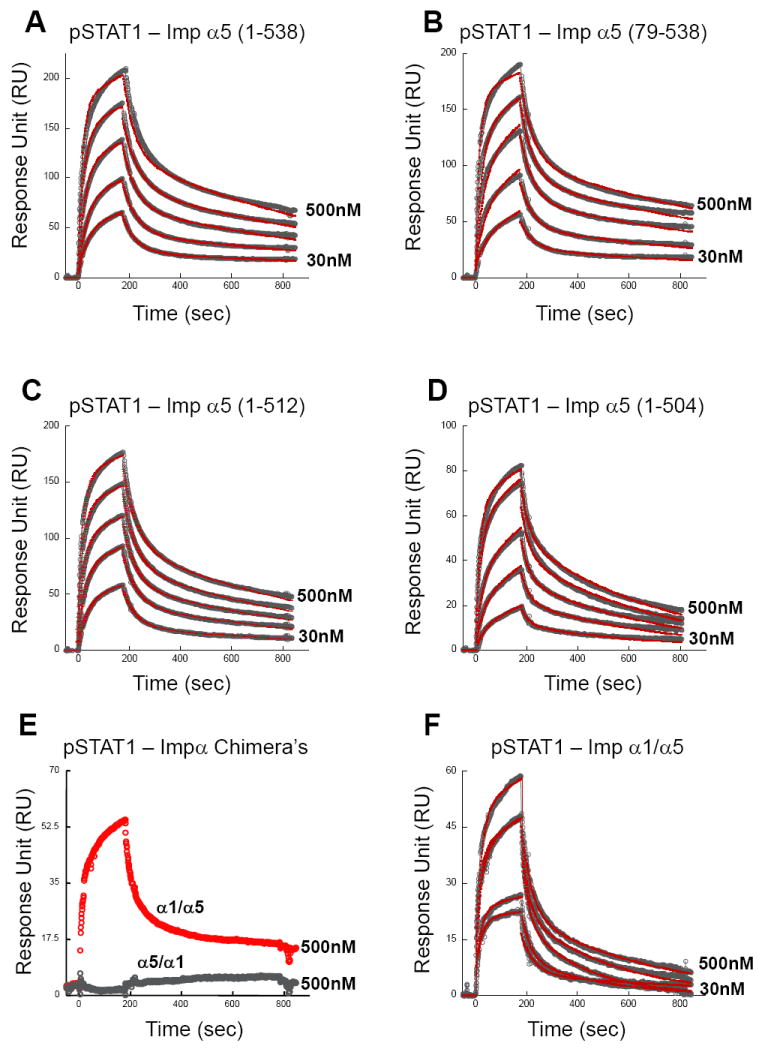
(A) GST-importin α5 (res. 1-538), (B) GST-ΔIBB-importin α5 (res. 79-538), (C) GST-importin α5 (res. 1-512), (D) GST-importin α5 (res. 1-504), (E) GST-importin α1/α5 (res. 1-446 of α1/449-538 of α5) and (F) GST-importin α5/α1 (res. 1-449 of α5/447-529 of α1) were captured onto a sensor chip using an immobilized anti-GST antibody. Purified pSTAT1 (the analyte) was flown into the cell between concentrations of 30, 62.5, 125, 250 and 500 nM, at a flow rate of 30 μl/min. In each sensogram, raw data are shown as open circles and fit curves as red lines for five different concentrations of analyte. In panel (E), only raw data for one representative concentration of pSTAT1 is shown, corresponding to 500 nM. The sensogram for GST-importin α1/α5 binding to pSTAT1 (in red) is also included to better show the complete loss of GST-importin α5/α1 binding to pSTAT1 (in gray). A complete list of kinetic parameters is in Table I.