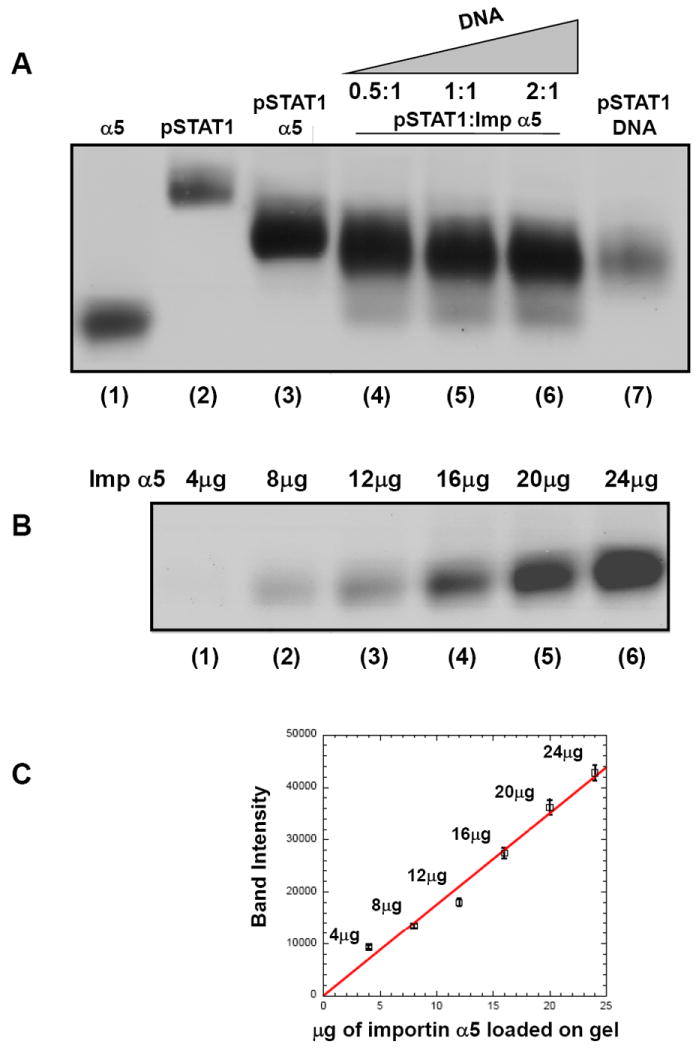
Figure 5. A DNA oligonucleotide containing two cfosM67-promoter elements can displace importin α5 from pSTAT1.

Electrophoretic mobility shift assay on native agarose gel. Free importin α5 (24 μg), pSTAT1 (25 μg) and the pSTAT1:α5 complex (60 μg) are in lanes 1, 2 and 3, respectively. Addition of 0.5-, 1.0-, 2.0-fold molar excess (over importin α5) of a 38-mer dsDNA oligonucleotide containing two cfosM67-promoter elements to 60 μg of pSTAT1:α5 displaces importin α5 from pSTAT1 and yields a new pSTAT1:DNA complex (in lanes 4, 5, 6, respectively). A control of the pSTAT1:DNA complex formed by adding an excess of DNA to 25 μg pSTAT1 is in lane 7. (B) Importin α5 titration on native agarose gel. 4, 8, 12, 16, 20, and 24 μg of importin α5 were loaded in lanes 1-6, respectively. (C) Standard curve calculated for the intensity of importin α5 bands in panel B. The band intensity was quantified densitometrically. A line of best fit was calculated using the ordinary least squares method in KaleidaGraph ®. The error bars represent the standard deviation of three independent quantifications.
