
Fig. 1.
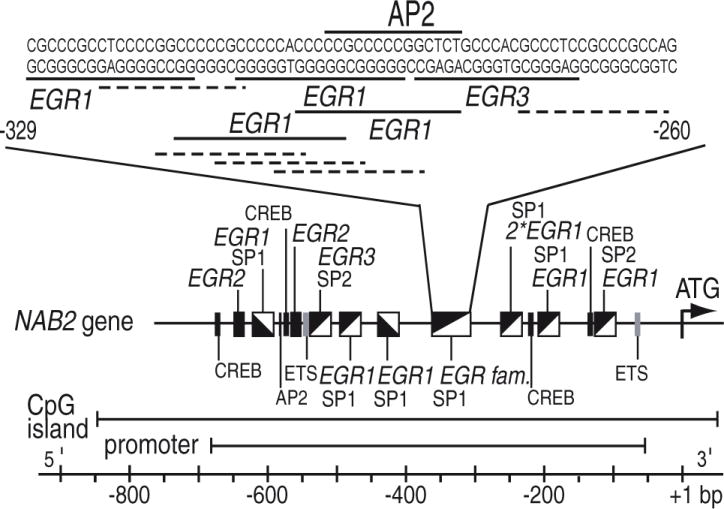
Schematic representation of the NAB2 5′ region. Numbering is in relation to translation start site (+1). Identified promoter region, CpG island, and putative transcription factor binding sites are indicated. EGR family member sites are highlighted in italics. The detailed sequence of the major regulatory element in the NAB2 promoter between bp −329 and −260 including putative binding motifs (dotted line = SP1 binding site, solid line = EGR family member site) is displayed.