
Figure 4.
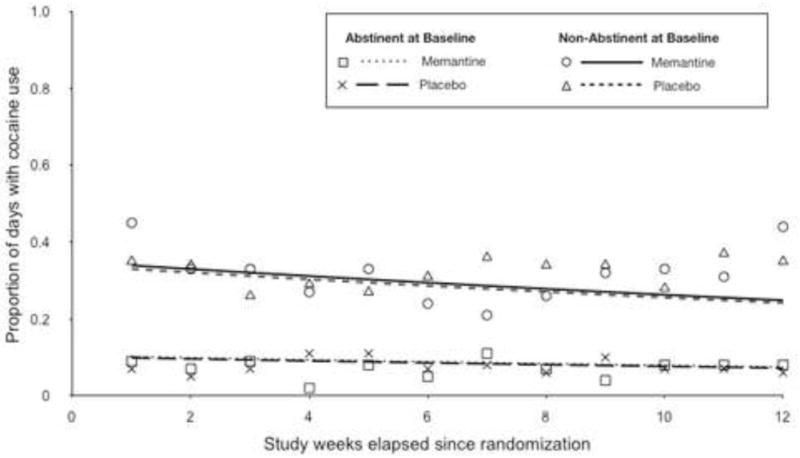
Proportion of days with cocaine use, by treatment and abstinence at baseline. Plot shows observed group means (symbols) and GEE fitted lines.
Official websites use .gov
A
.gov website belongs to an official
government organization in the United States.
Secure .gov websites use HTTPS
A lock (
) or https:// means you've safely
connected to the .gov website. Share sensitive
information only on official, secure websites.
Proportion of days with cocaine use, by treatment and abstinence at baseline. Plot shows observed group means (symbols) and GEE fitted lines.