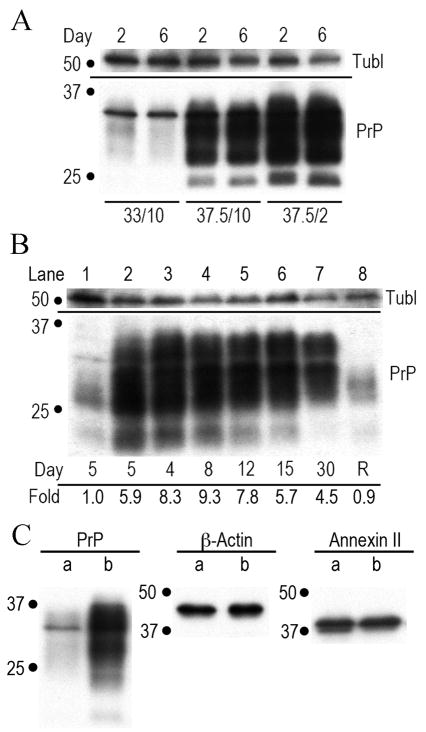
Fig. 2.
shows representative Western blots of PrP and other normalization markers such as tubulin (tubl). All cells were equally loaded as determined by protein assay. Fig. 2A shows the PrP in control proliferating cells (first two lanes) with 1x PrP at 2 and 6 days. Lanes 3–4 and 5–6 show cells at 37.5°C with high serum and low serum respectively. Fig 2B shows that stationary cells continuously produce high amounts of PrP for 30 days (days indicated). Lane 8 shows stationary cells returned to standard proliferative conditions after 14 days (R) revert to their original low PrP state. PrP levels (fold) are shown under the lanes. Fig. 2C show proliferative (a) and 37.5°C-2% serum arrested cells at 5 days (b) stained for PrP, β-Actin and Annexin II. Only the PrP amount is changed (5.3 fold the proliferative control).

